 After nearly four years there is a new version of
PilotPlot for PalmOS available. But for now it is only a maintenance release. It is
compiled using the current PalmOS SDK 5.0r3. Since it uses this new SDK it should
work on all PalmOS devices without problems.
After nearly four years there is a new version of
PilotPlot for PalmOS available. But for now it is only a maintenance release. It is
compiled using the current PalmOS SDK 5.0r3. Since it uses this new SDK it should
work on all PalmOS devices without problems.
The problem I had in the last four year (beside having not much time) was that the program got larger
than 64KB and the linker was unable to create an executable. Now I tried it again with the current prc-tools 2.2.90, the
new SDK and some good documentation for prc-tools. I had to change some header files and use the MathLib again, but then
it compiled nearly immediately. Since I am now able to compile it, I will perhaps add some new features in the next time (23.07.2004).
I finally got the new compiler running. I use now a mixture of prc-tools 2.0 and the cvs-content of the development of prc-tools 2.1. I made a special version that does not need the mathlib and supports the PalmIIIc. You should use this version only with the PalmIIIc. It should also work with any other Palms but lacks the features of grayscale and the virtual screen, that only work with non-color Palms. It has no new features, its only purpose is to support the PalmIIIc. I plan to make a better color version until november. I will send some mails to all the people who asked for a color version when a good version is available.
This new versions 0.6.7 and 0.6.8 are bugfixed versions of 0.6.5. I got a mail and was able to reproduce the effect, that when you load a function from the function table, it was not shown correctly in the function field. This is now fixed in 0.6.7 and 0.6.8. The difference between these two versions is, that in 0.6.8 you come back to the main form when pressing the delete-button in the function list form and in 0.6.7 you can continue doing things with the function table. Version 0.6.8 was made because 0.6.7 crashes with a Palm IIIxe.
But there is another problem: The code of the program has nearly reached the size of 32K. The compiler I use (prc-tools 0.5.0) seems to have a limit here. It depends on the architecture of the Palm and will be solved in the new version of prc-tools that will be available at http://prc-tools.sourceforge.net soon (I hope). I will also try Version 0.6.0 which is available from somewhere else, but the link can be found at the same URL. Until then it will be impossible for me to add new functions because the linker already gave me several fatal errors (.text segment too large) and I had to search where to reduce the code to make 0.6.5.
Since version 0.6.0 it has a database where you can save and load functions and their coordinates.
With version 0.6.2 the
backup-bit of the application and the function-database is set and a problem with the scrollbar in the
function-table is solved.
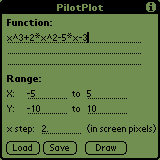 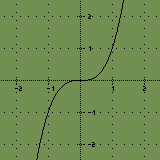
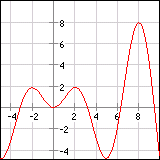
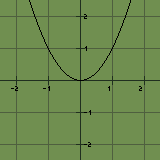
Screen shots from Palm-emulator. The right image shows x^3. |
PilotPlot for PalmOS v. 0.6.8PilotPlot is a simple function plotter but with the special feature of a larger virtual screen. The function is plotted into a virtual screen which you can scroll around by dragging the pen on the display. Currently the virtual screen is up to nine times larger than the display. You can drag it around in real time and leave it by tapping on the graffity area.This program is still under development. So there will be better versions with more functions to come. If you find any errors please let me know and I will try to correct them. The program has cut, copy and paste support, a scrollable multiline-input-line for the function and a small database to save functions and coordinates. You can also now write "pi" instead of writing 3.1415... Since version 0.6.5 a table of values has been added. You can access it by using the menu of the program (Function->Table). |
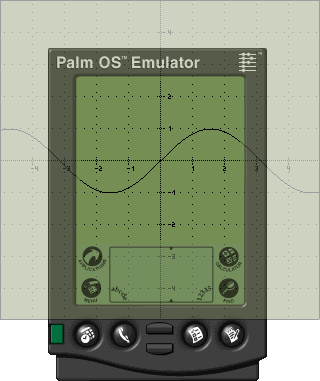  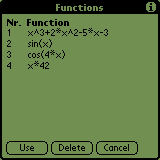 Screen shot of grayscale version (since 0.4.5) and the database screen (since 0.6.0). Select 320x320x4 from menu to get grayscale display. 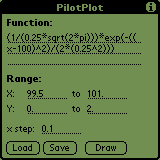 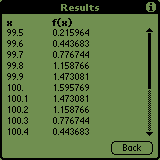 These three images show another function and the new feature since 0.6.5, the table of values. 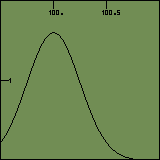 |
LicenseThis program is freeware. I am not responsible for any damages or anything that might result from using this program. You use it at your own risk.Features
Planned future enhancements
DocumentationCurrently there is no additional documentation available except the information from this page. If you have questions then please send an email to me and I will put the answers here on this web site until a real documentation is available. Up to now there were these questions:
DownloadPilotPlot070.zip - new Version 0.7.0 (67k, needs Mathlib again!)PilotPlot069colorbeta.zip - new Version 0.6.9colorBETA (35k, does not need Mathlib) PilotPlot069coloralpha.zip - new Version 0.6.9colorALPHA (35k, does not need Mathlib) PilotPlot068.zip - Version 0.6.8 (18k) PilotPlot067.zip - Version 0.6.7 (18k) PilotPlot065.zip - Version 0.6.5 (18k) PilotPlot062.zip - Version 0.6.2 PilotPlot061.zip - Version 0.6.1 PilotPlot060.zip - Version 0.6.0 PilotPlot055.zip - Version 0.5.5 PilotPlot050.zip - Version 0.5.0 PilotPlot045.zip - Version 0.4.5 PilotPlot040.zip - Version 0.4.0 You also need the Mathlib to run the program. The newest version is available from http://www.radiks.net/~rhuebner/index.html. History
|
This website does not save any personal information. It uses no cookies and the server logs are anonymized.